
I Fixed the Biggest Mistake in Religion Surveys (and It Barely Changed the Results)
Graphs About Religion! (Ryan Burge please don't sue me.)

For a project I’m working on, I needed to know how many babies the average person had in all of America’s major religions.
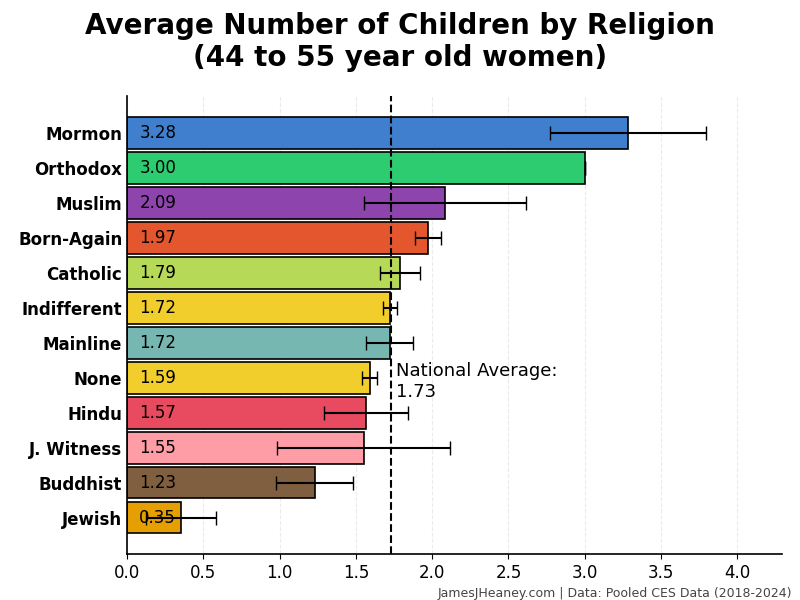
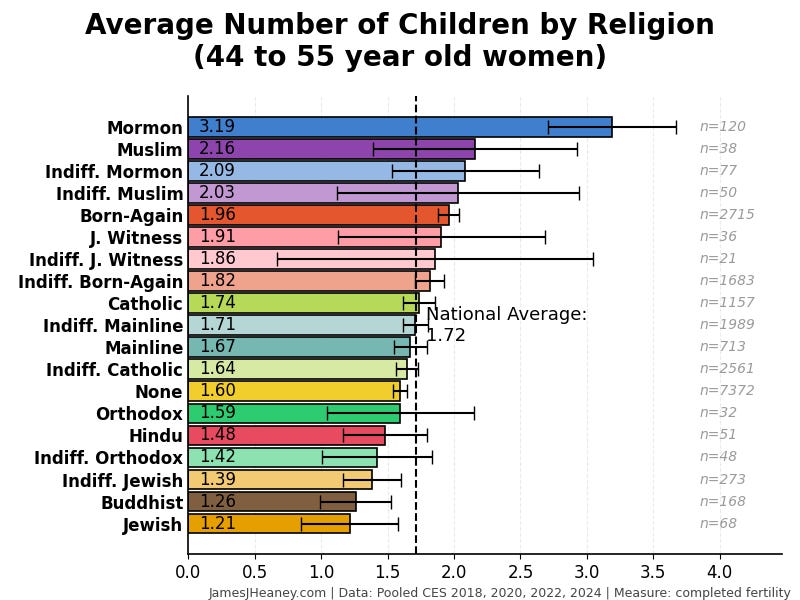
Every two years, the Cooperative Election Survey asks 60,000 Americans a bunch of questions. Over the past four surveys (~240,000 validated Americans), here is how many babies women had in each of several major religions:1
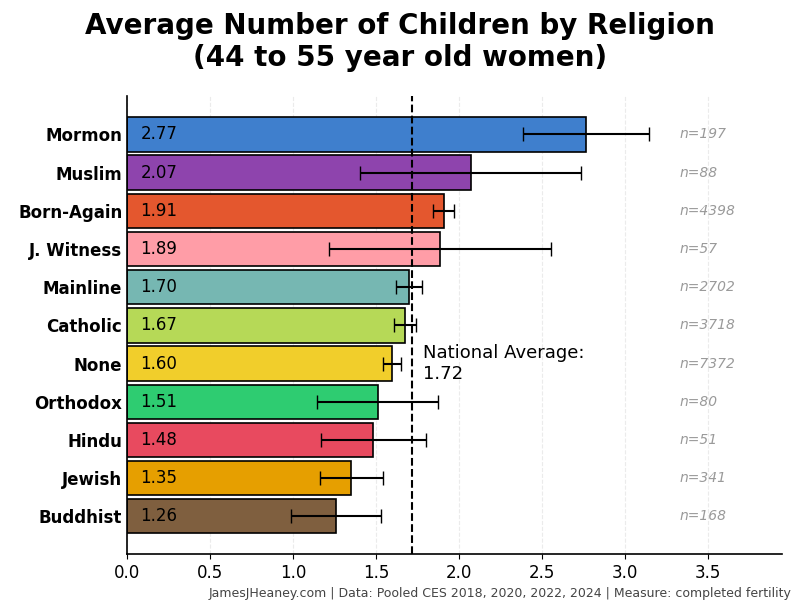
Many Bothans died shrinking those error bars to a reasonable size.2

I could have pulled a similar chart from any number of existing sources. Many people have already asked the question, “How many babies do women in each religion have?” and they have posted their answers right here on the Internet.
Unfortunately, I think all their answers are wrong, because they aren’t asking quite the right question.
You know the saying, “All models are wrong, but some are useful”? I think the basic model we have for surveying religion in the United States is not the most useful way of looking at American religion.
Indifference is Not Religion
The typical American religious pie chart looks like this:
(Note to email readers: over on the webpage, you can interact with this pie chart! Turns out the Datawrapper plugin is open to every Substacker, not just Nate Silver!)
However, the majority of self-identified Catholics in surveys are not “Catholic” in any useful sense. Most “Catholics” in surveys are only Catholics in a cultural sense. It is part of their background, their family story, but makes little actual difference to what they believe or how they live. They pray sometimes, perhaps. Some even consider religion important to them! However, they live primarily as Americans, not as Catholics, practicing the standard Doesn’t-Matterism of 21st century America.
As I wrote just after the 2024 election:
Because cultural Catholics are basically just ordinary Americans who might say the Hail Mary once in a while, and because there are so many of them, when you poll “Catholics” without filtering for specifically religious Catholics, you’re basically just getting a random sample of ordinary Americans. Their polling responses are basically always pretty much exactly the same as polling results for normal Americans, unless you ask them about St. Patrick’s Day or tacos.
(That’s the other thing about Catholics: churchgoing or not, we are disproportionately White—specifically Irish—and Hispanic.)
Whenever someone shows you a chart about Catholics, with no filtering, you’re usually better off cutting out the middleman and just looking up a chart about Hispanics and Scots-Irish instead.
I don’t know whether this is as pronounced in other religions as it is in Catholicism, but every religion has people who identify as part of it without living like it. The great Ryan Burge has single-handedly changed how we think about Evangelicals simply by pointing out how many cultural Evangelicals there are—and how much they (increasingly) differ from devout Evangelicals.
When I see graphs about religion, then, I always want to factor out the people who aren’t actually all that interested in their self-reported religion.
Definitional Problems
Unfortunately, it’s not a simple matter to identify these “Doesn’t-Matterists” or “Indifferentists.”
First, in reality, indifferentism lives on a spectrum, so any line we draw between “indifferent” and “devout” will be arbitrary. No matter what we do, we’re going to count some people as “indifferent” who should count as “devout” and vice versa.
Second, definitions of what makes one “devout” will vary from religion to religion. For example, as a Catholic, I considered defining an “indifferentist” as “someone who believes it is morally acceptable to use artificial birth control,” which is a key fault line between devout Catholics and cultural Catholics. However, that definition would hardly work for Protestantism, where even the devout accepted contraceptives wholesale between 1930 and 1970. Maybe I should define an “indifferent Protestant” as someone who rejects Biblical inerrancy? But then how would I define indifferent Jews? Or, for that matter, how would I then define indifferent Mainline Protestants, since most of the Mainline rejects Biblical inerrancy? And so on. Even if this didn’t thrust me into the doctrinal minefields of a dozen religions I don’t even belong to, defining indifference as a matter of heterodoxy is simply unworkable.
Third, indifference is not quite the same thing as heterodoxy. Lots of Catholics who contracept are very invested in their religion, show up to Mass every week, and are very upset about the Church’s teaching. You could call them heretics, you could call them sinners, but you can’t call them indifferent!
America’s Common Hour
One striking commonality among major American religions is the requirement to go to church every week.
In Catholicism, failure to attend Sunday services without a serious reason is (ordinarily) a mortal sin. Protestantism inherited this rule from Catholicism. While their various denominations have transformed the rule in many different directions, there remains a strong expectation in most of Protestantism that the faithful will attend Sunday services weekly. Jehovah’s Witnesses have no “official” attendance requirement, but anyone not in the pew weekly will get hounded by their elders. Muslims have rigid weekly attendance requirements at mosque. And so on.3 Certainly there is a strong correlation between non-attendance and indifference to doctrine, indifference to prayer, indifference to religious disciplines, and so on.
That, then, is where I have drawn the line. People who attend religious services “once or twice a month” or less are the group I consider “indifferent.”4 Once you account for this, the religious pie chart from before shifts a lot:
Religion Minus Indifferents
Of course, I could make a pie chart showing allllll the different types of religiously indifferent Americans: the indifferent Catholics versus the indifferent Evangelicals versus the indifferent Jews, and so on. In fact, just for you, I’ll do that in this footnote.5
However, in my experience, all else being equal,6 the religiously indifferent from have more in common with one another (religiously speaking) than they do with their self-identified co-religionists. (Their actual religious beliefs tend to all boil down to Moralistic Therapeutic Deism.) So I have opted, on this chart, to put the indifferent from all faiths into their own giant pie slice.
I think this is, for most purposes, a more accurate representation of the true religious currents in the United States. America is mostly divided between the Nones and the Moralistic Therapeutic Deists. (I have not checked their political alignments, but suffice to say I have some suspicions.) There is no moral majority. There is a rather meagre minority, often divided against itself on important questions. No wonder it often feels besieged.
The share of devout Catholics in the U.S. is not one-fifth to one-quarter, as is often reported, but about one-twentieth. Catholicism is a rump religion. Its numbers are inflated by its powerful cultural influence, which lingers, sometimes for generations, after its former adherents have, for all intents and purposes, abandoned Rome. What cultural Catholics do and think does not necessarily indicate what practicing Catholics do and think.
The Protestant Mainline, once the dominant religious and cultural force in America, has for all practical purposes ceased to exist.
Even the Born-Agains don’t look too hot by these numbers, although they are (clearly, by far) the largest and most influential religious group in America, more than double the size of the Catholics.
So this chart—the truer chart, in my opinion—presents a lot of food for thought.
However, today, I only care about fertility by religion.
Fertility by Religion, James-Style
In conclusion, here is the fertility chart from the start of the article, but now with Indifferents factored out:
This… isn’t that different from the original chart, is it? What do you call it when you finally ask the right question, but get the same answer?
It’s worth examining this in a little more detail:
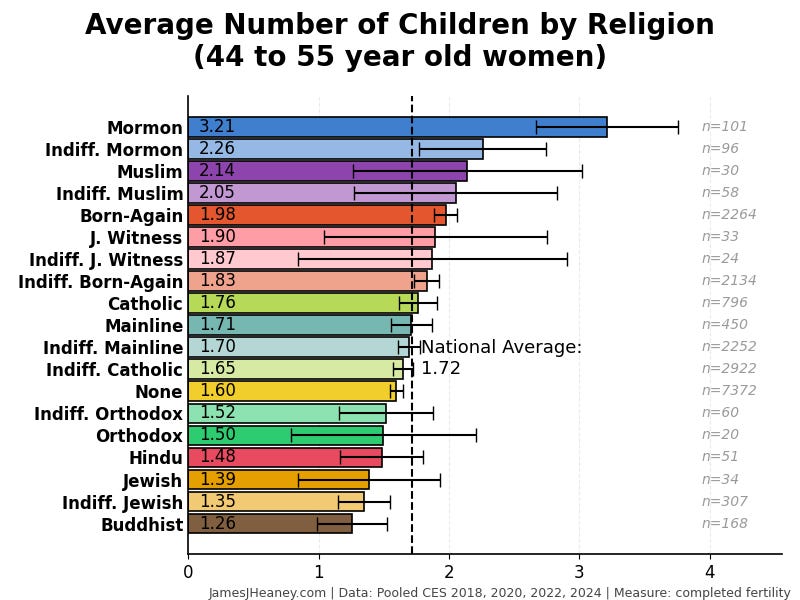
There are two interesting patterns here:
First, religious involvement is associated with fertility. This is well-documented and not a surprise, but it is still satisfying to see the effect holding consistent across religions. Churchgoing Catholics are more fertile than Indifferent Catholics, Born-Agains than Indifferent Born-Agains, and so on. This relationship gets muddy in a few places on the chart, but I think we can chalk that up to small sample sizes causing large margins of error.
Second, religious involvement’s association with fertility, while real, isn’t that strong. When I rendered this chart, I expected to see a chart where all the “devout” religious cohorts were at the top, in order, followed by all the “indifferent” cohorts at the bottom. For example, I expected Indifferent Mormons to be more fertile than Indifferent Catholics, but I expected Churchgoing Catholics to be substantially more fertile than both.
The reality is close to the opposite! Over and over again on this chart, the Churchgoing and Indifferent bands for a religion are found right next to one another. Churchgoing Mormons are more fertile than Indifferent Mormons… but Indifferent Mormons are still more fertile than everyone else. This suggests three theories:
Fertility is driven much more strongly by demographics (race, income) and culture (what your neighbors are doing, the messages you receive) than by religious practice or belief.
The people I’ve labeled “indifferent” aren’t as indifferent as I thought, and many continue to be believe and practice in limited ways even after abandoning the standard practice of weekly attendance.7
The people I’ve labeled “indifferent” really are indifferent—but they didn’t used to be. They were raised devout, had some or all of their babies while devout, and then became indifferent, when it was too late to have an impact on their fertility.
As always, the true reason for this result is probably a mix of those theories, plus several others I haven’t thought of.
That’s all! Mormons have lots of babies, Buddhists don’t, news at 11. This post was merely a stepping stone to another post still in the works.
I’ve shared the code behind this post on my GitHub.8
This chart checks on 44-55 year old women, specifically, because they have (with very rare exceptions) finished having children.
You could use another measure, called Total Fertility Rate, to look at women of current reproductive age (15-44) and project how many total children they will have based on how many they have had already. This gives you more up-to-date information, but at the expense of adding more guesswork about future fertility patterns. Today, I prefer the “completed fertility” measure, because it involves no guesswork. Yes, it includes a few women who finished having babies quite a long time ago. For example, a 55-year old woman in the 2018 survey who had her last baby and had her tubes tied at age 39 finished childbearing way back in 2002! However, I don’t need cutting-edge, up-to-the-second fertility data here; fertility rates haven’t changed so quickly since the early 2000s that the changes are going to upend my analysis.
One note is that the CES caps reported fertility at 8. If you tell them you have 10 kids, they just put that under “8 or more” and it counts as 8 for my measurements in this article. People with more than 8 kids are so rare that it should make little difference to the outcome, but, still, it’s worth noting, since I know at least one man with 12 kids who reads this blog.
(This long footnote is all just talking about data and process. Pretty boring. Lots of pictures, but I put all my best and truest pictures in the main article.)
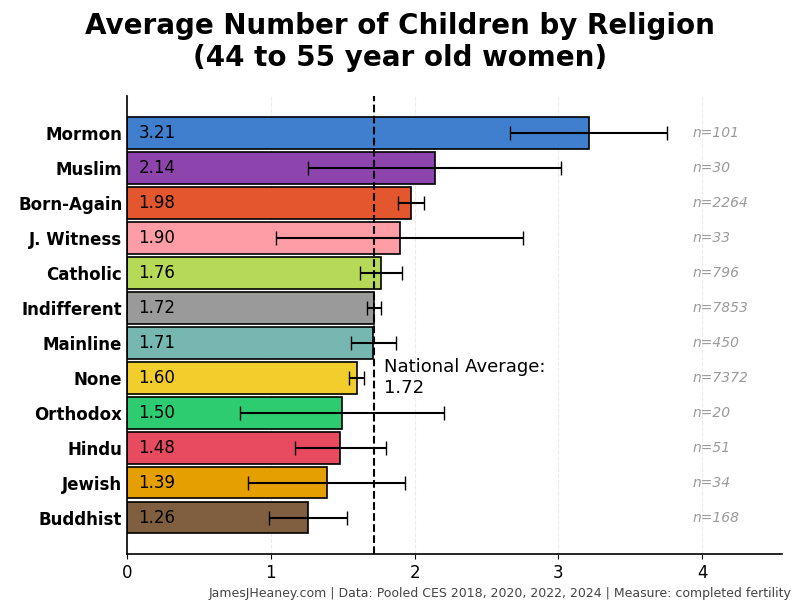
I started out by just looking at women in the 2024 Cooperative Election Survey, which got me this chart:
Some of these error bars are fine! There are 1,617 religiously unaffiliated women represented in the Nones bar on this chart, which is plenty to give us a good reliable estimate of how many children non-religious women had, on average.
However, in the entire 60,000 person sample, there were only 22 Muslim women aged 44-55. That makes sense, demographically! Muslims are less than 1% of the population. But the result was a 95% confidence interval that ranged from 1.11 child per Muslim woman all the way up to 3.84 children per Muslim woman. In other words, because this sample was so small, Muslims could quite plausibly be anywhere from the least fertile religion to the most fertile religion. Jehovah’s Witnesses (Observations in sample: just 12) are even worse. Holy error bars, Batman!
I first tried to correct this by widening the sample, counting men and expanding the age range:
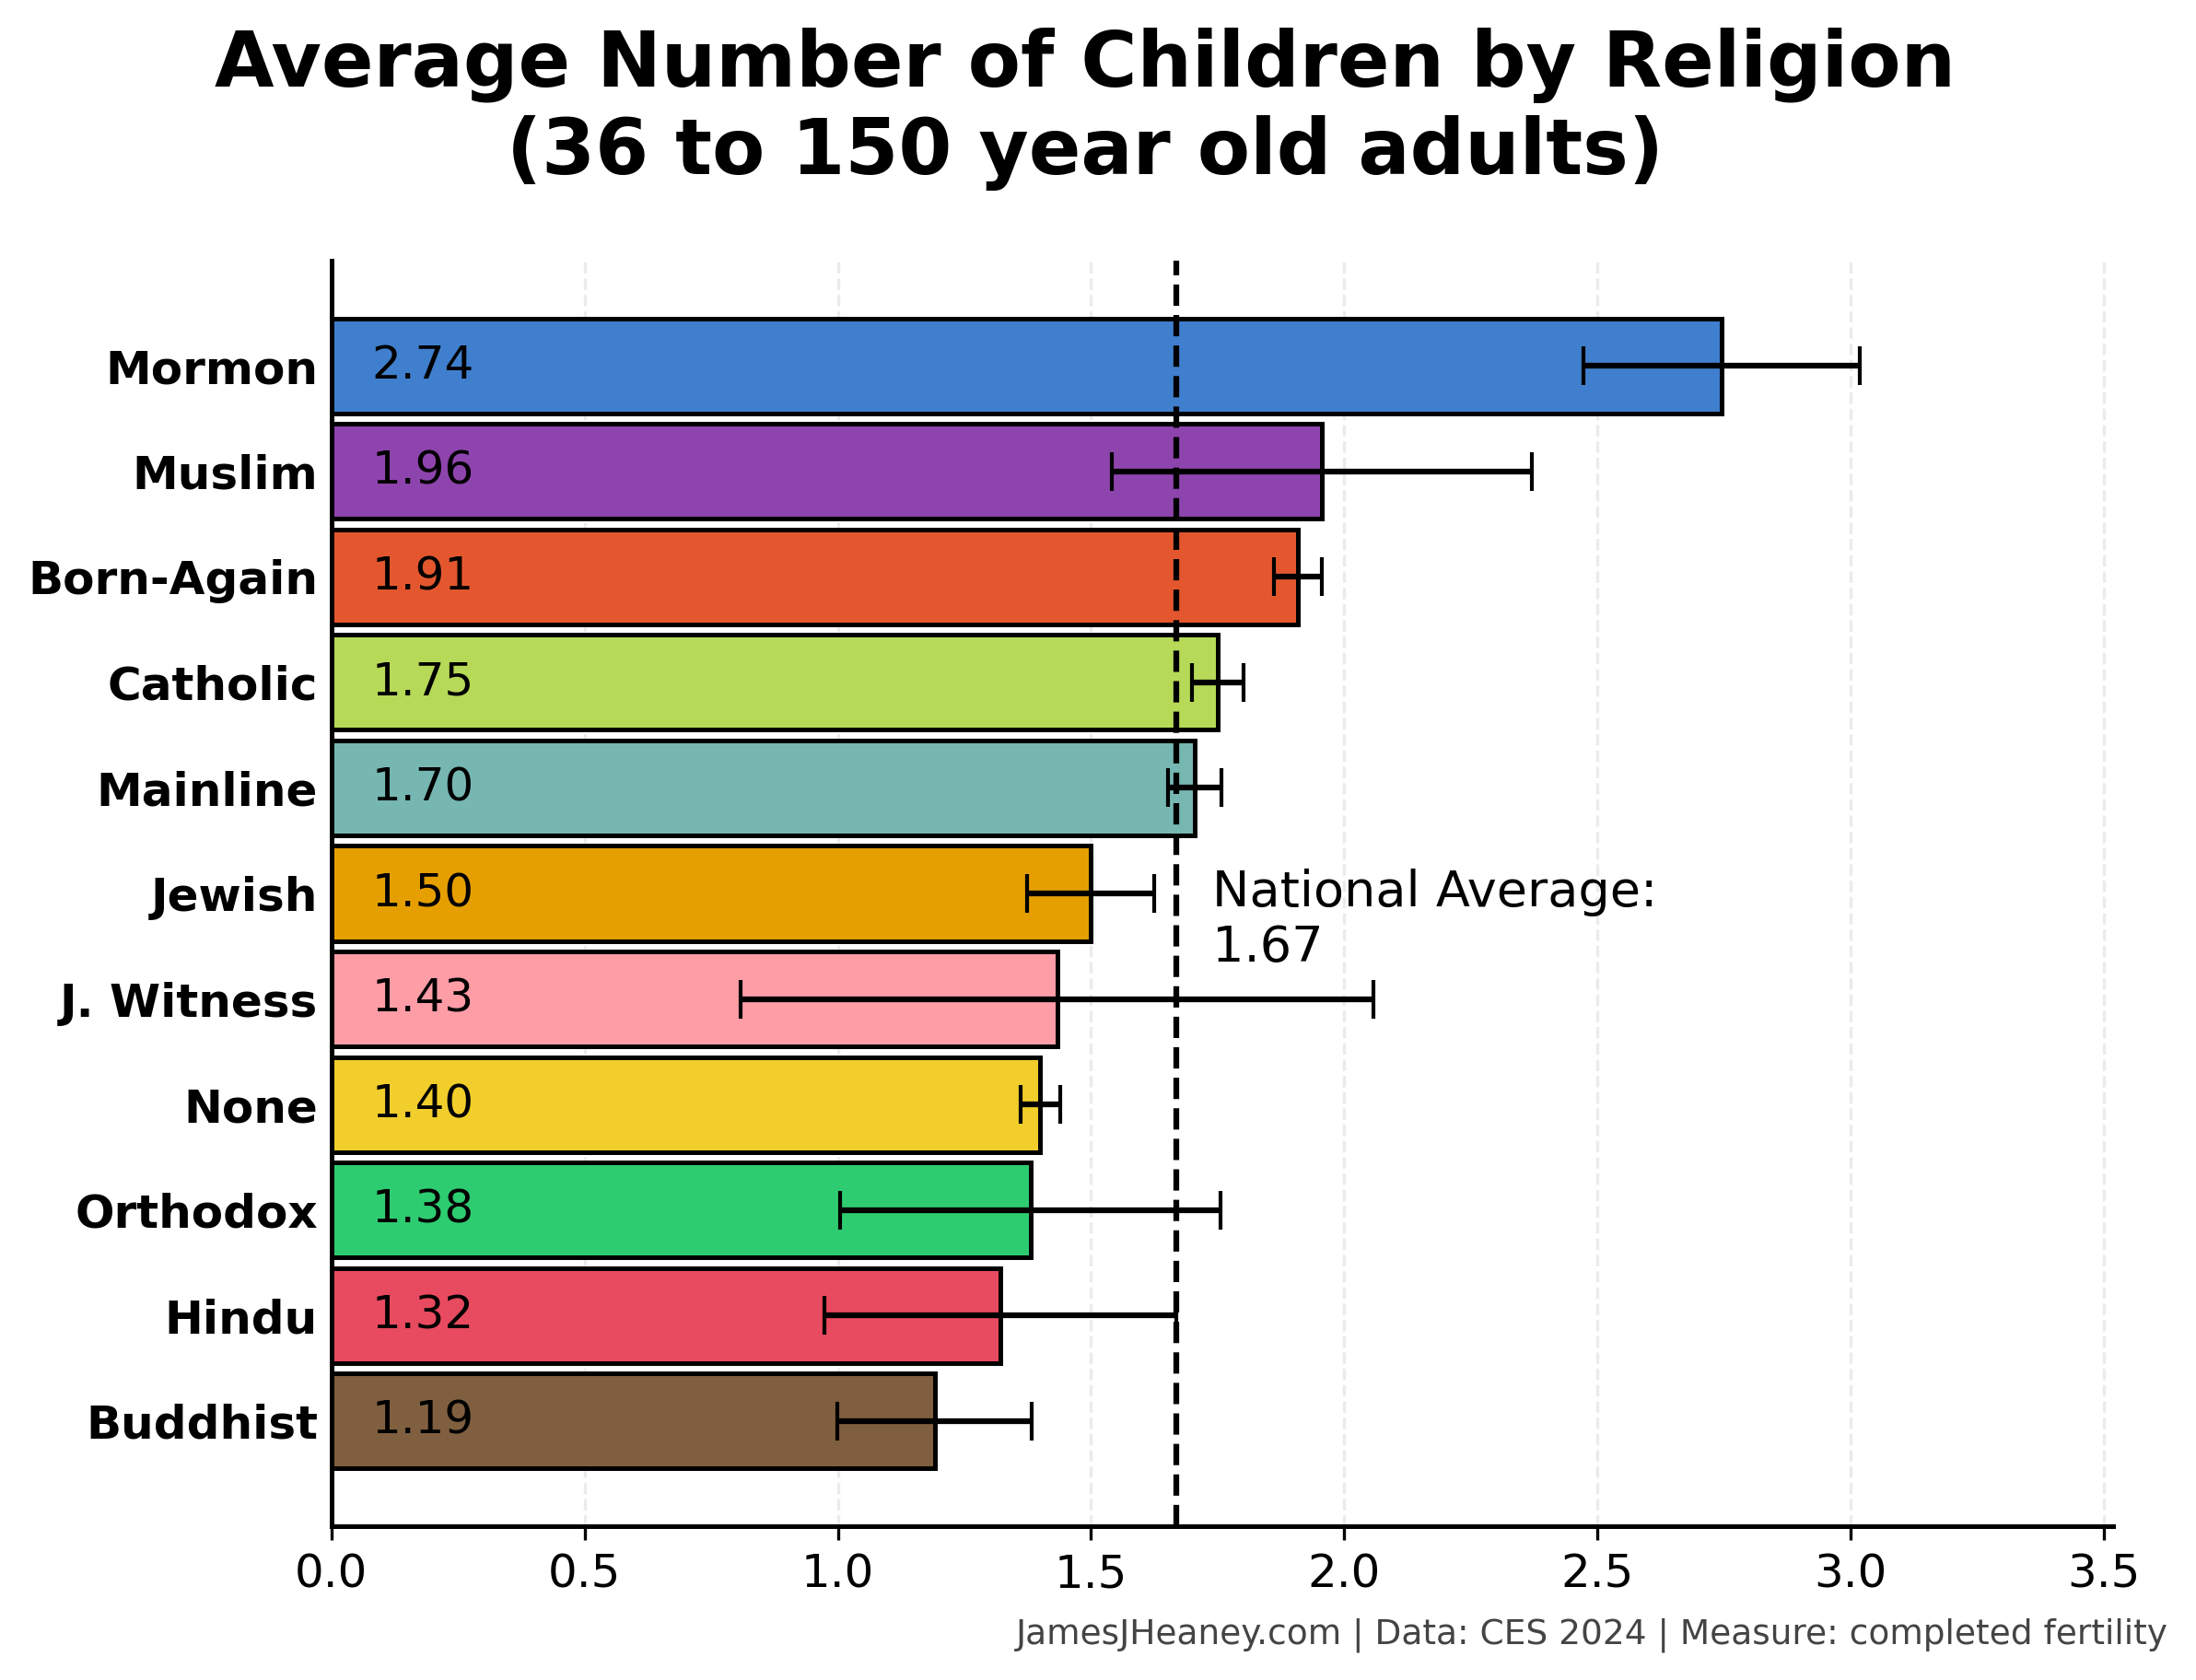
The benefit of this approach is that it really does give us a lot more data. There are 38,943 people in this sample, versus just 4,530 in the previous sample. That shrinks the error bars a lot!
The problem is that it sweeps in much, much older data. A 100-year-old Catholic woman who had her last baby in 1961 will now be included in this sample—but Catholic fertility was considerably higher in 1961 compared to today, which means this paints a less accurate picture of religious fertility today.
The expanded sample also sweeps in some younger women who may not have completed childbearing yet, artificially lowering the stats for religions where women tend to have their kids later in life (like the Nones).
The other thing I just don’t like very much here is including men. Men don’t have the babies, they can have babies at all ages, and it’s apparently well-known that they systematically underreport their number of kids to researchers.
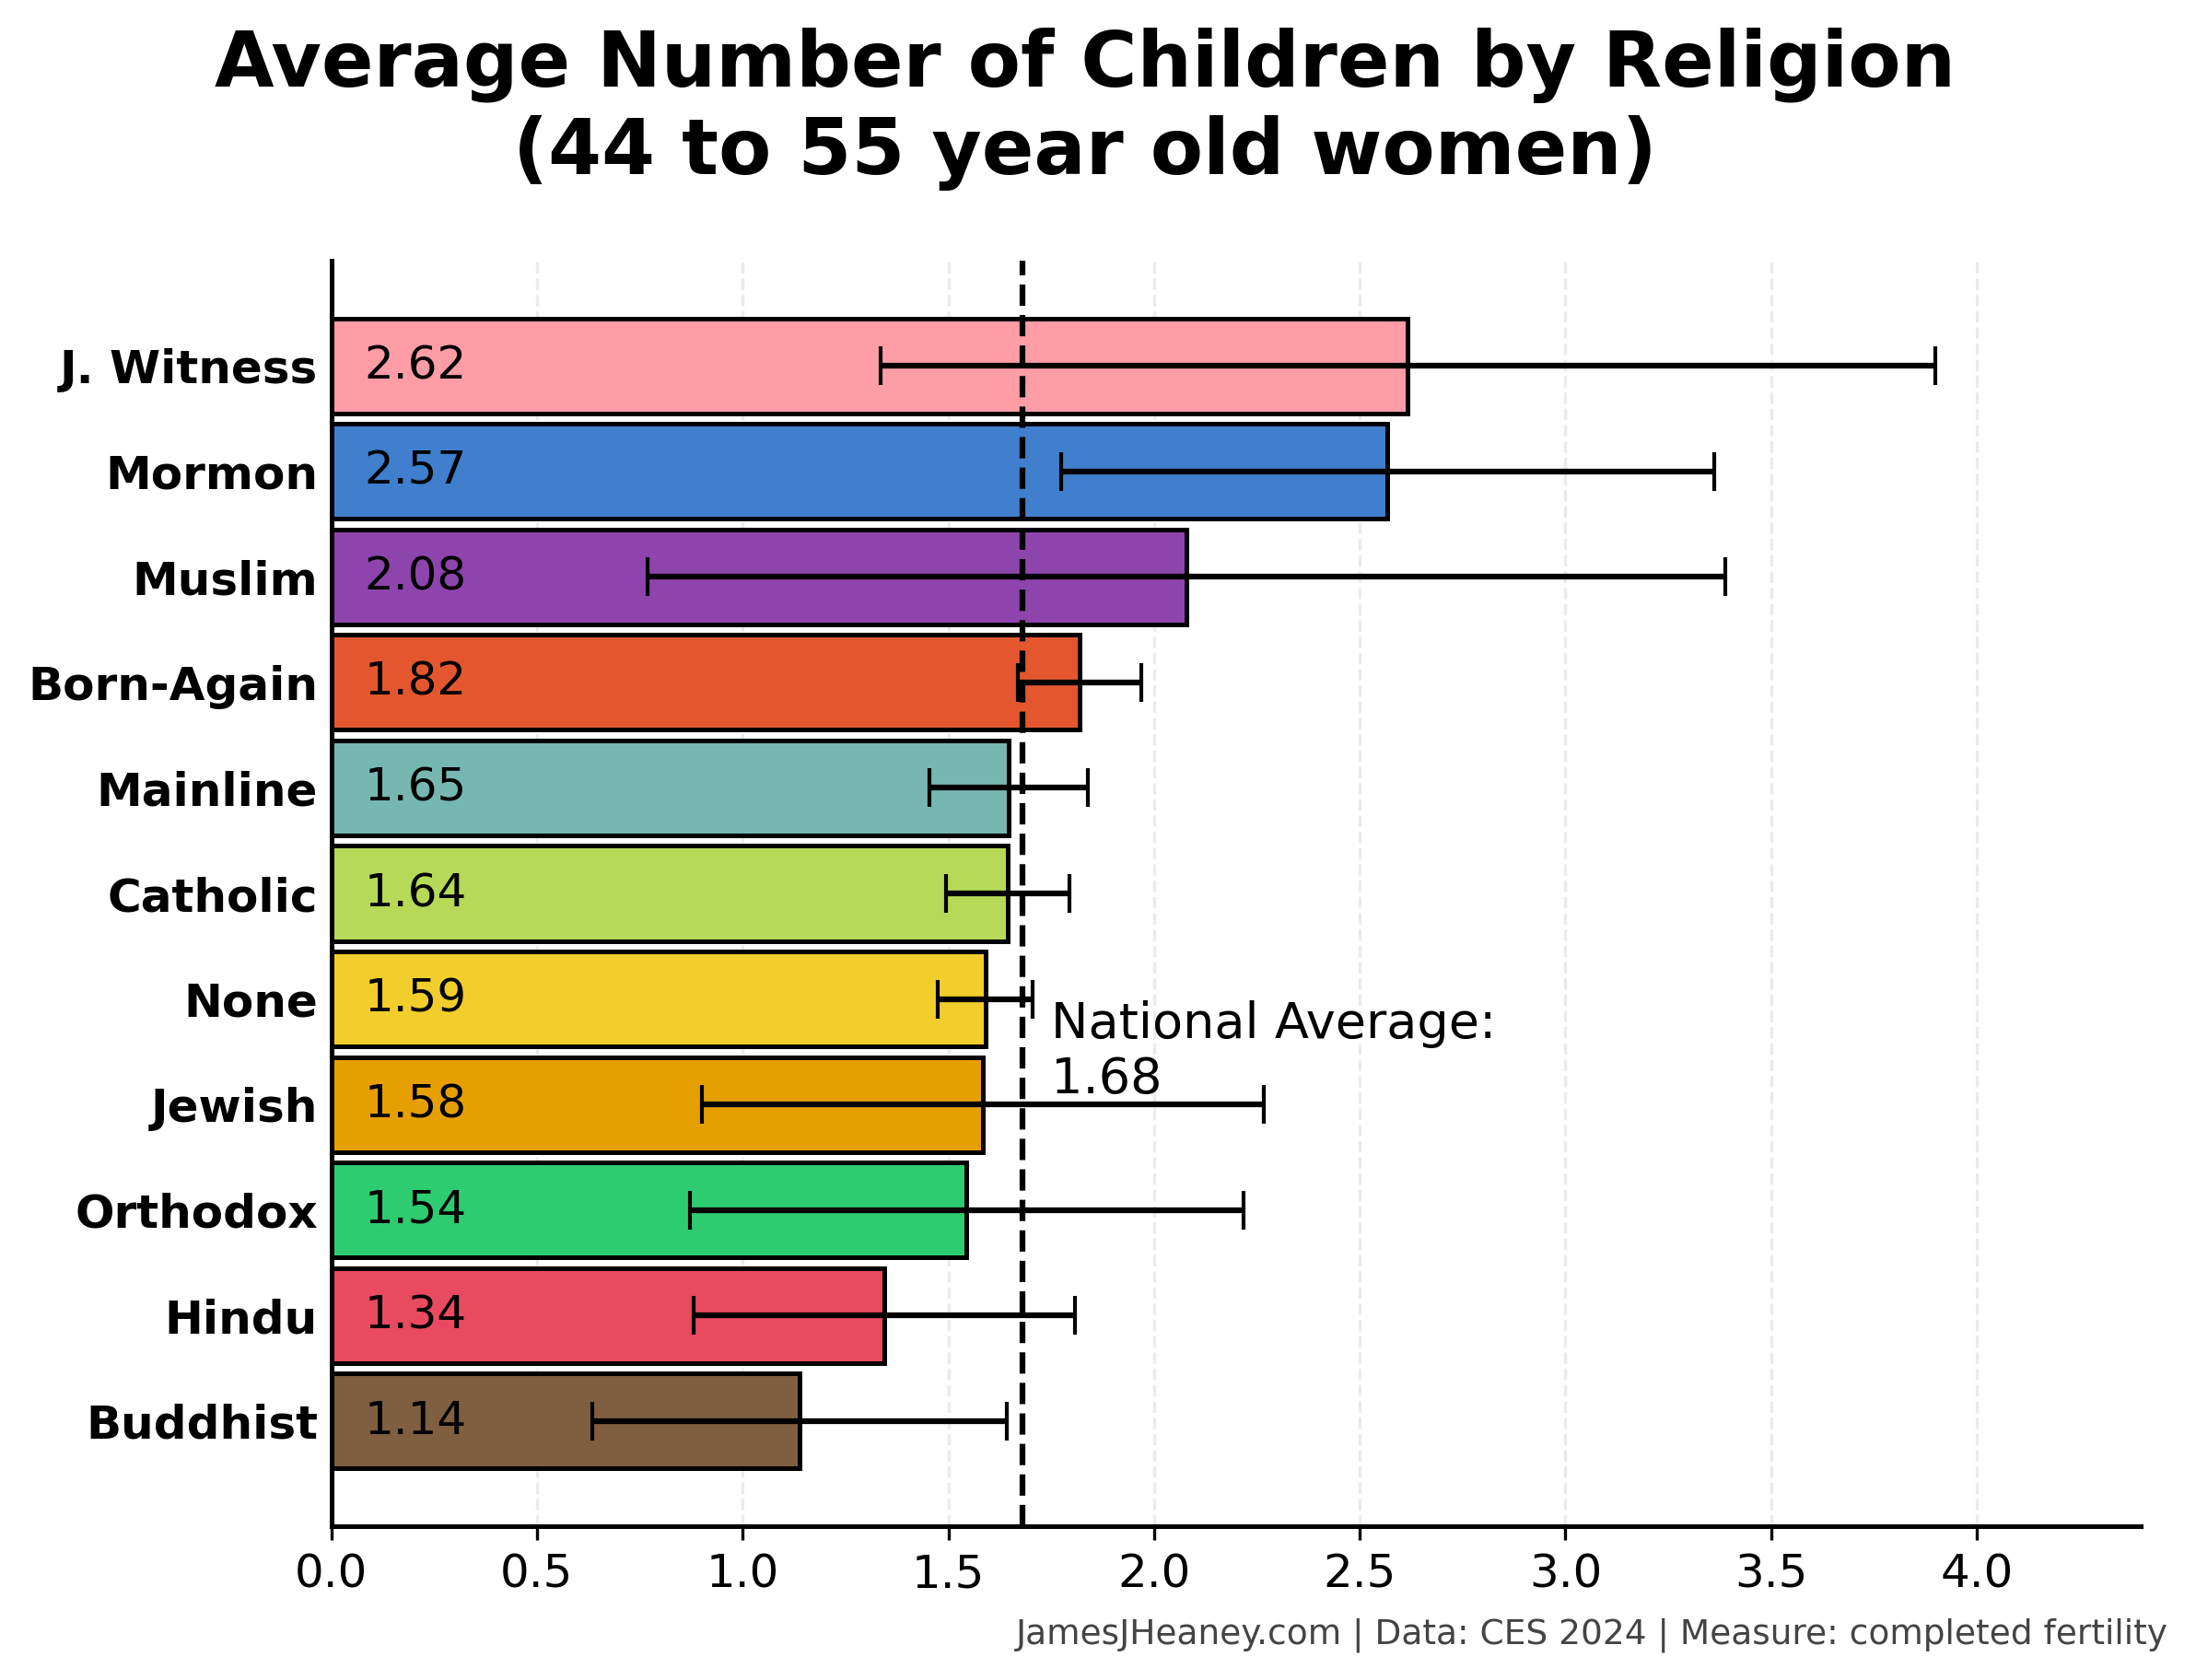
A few years back, Ryan Burge, the gold standard in graphs about religion, asked a similar question (with the CES 2020 rather than the CES 2024), but he took a slightly different approach: he looked at 35-45 year-old adults who had children in the household (ignoring adults who had no children, which obviously raised his averages!):
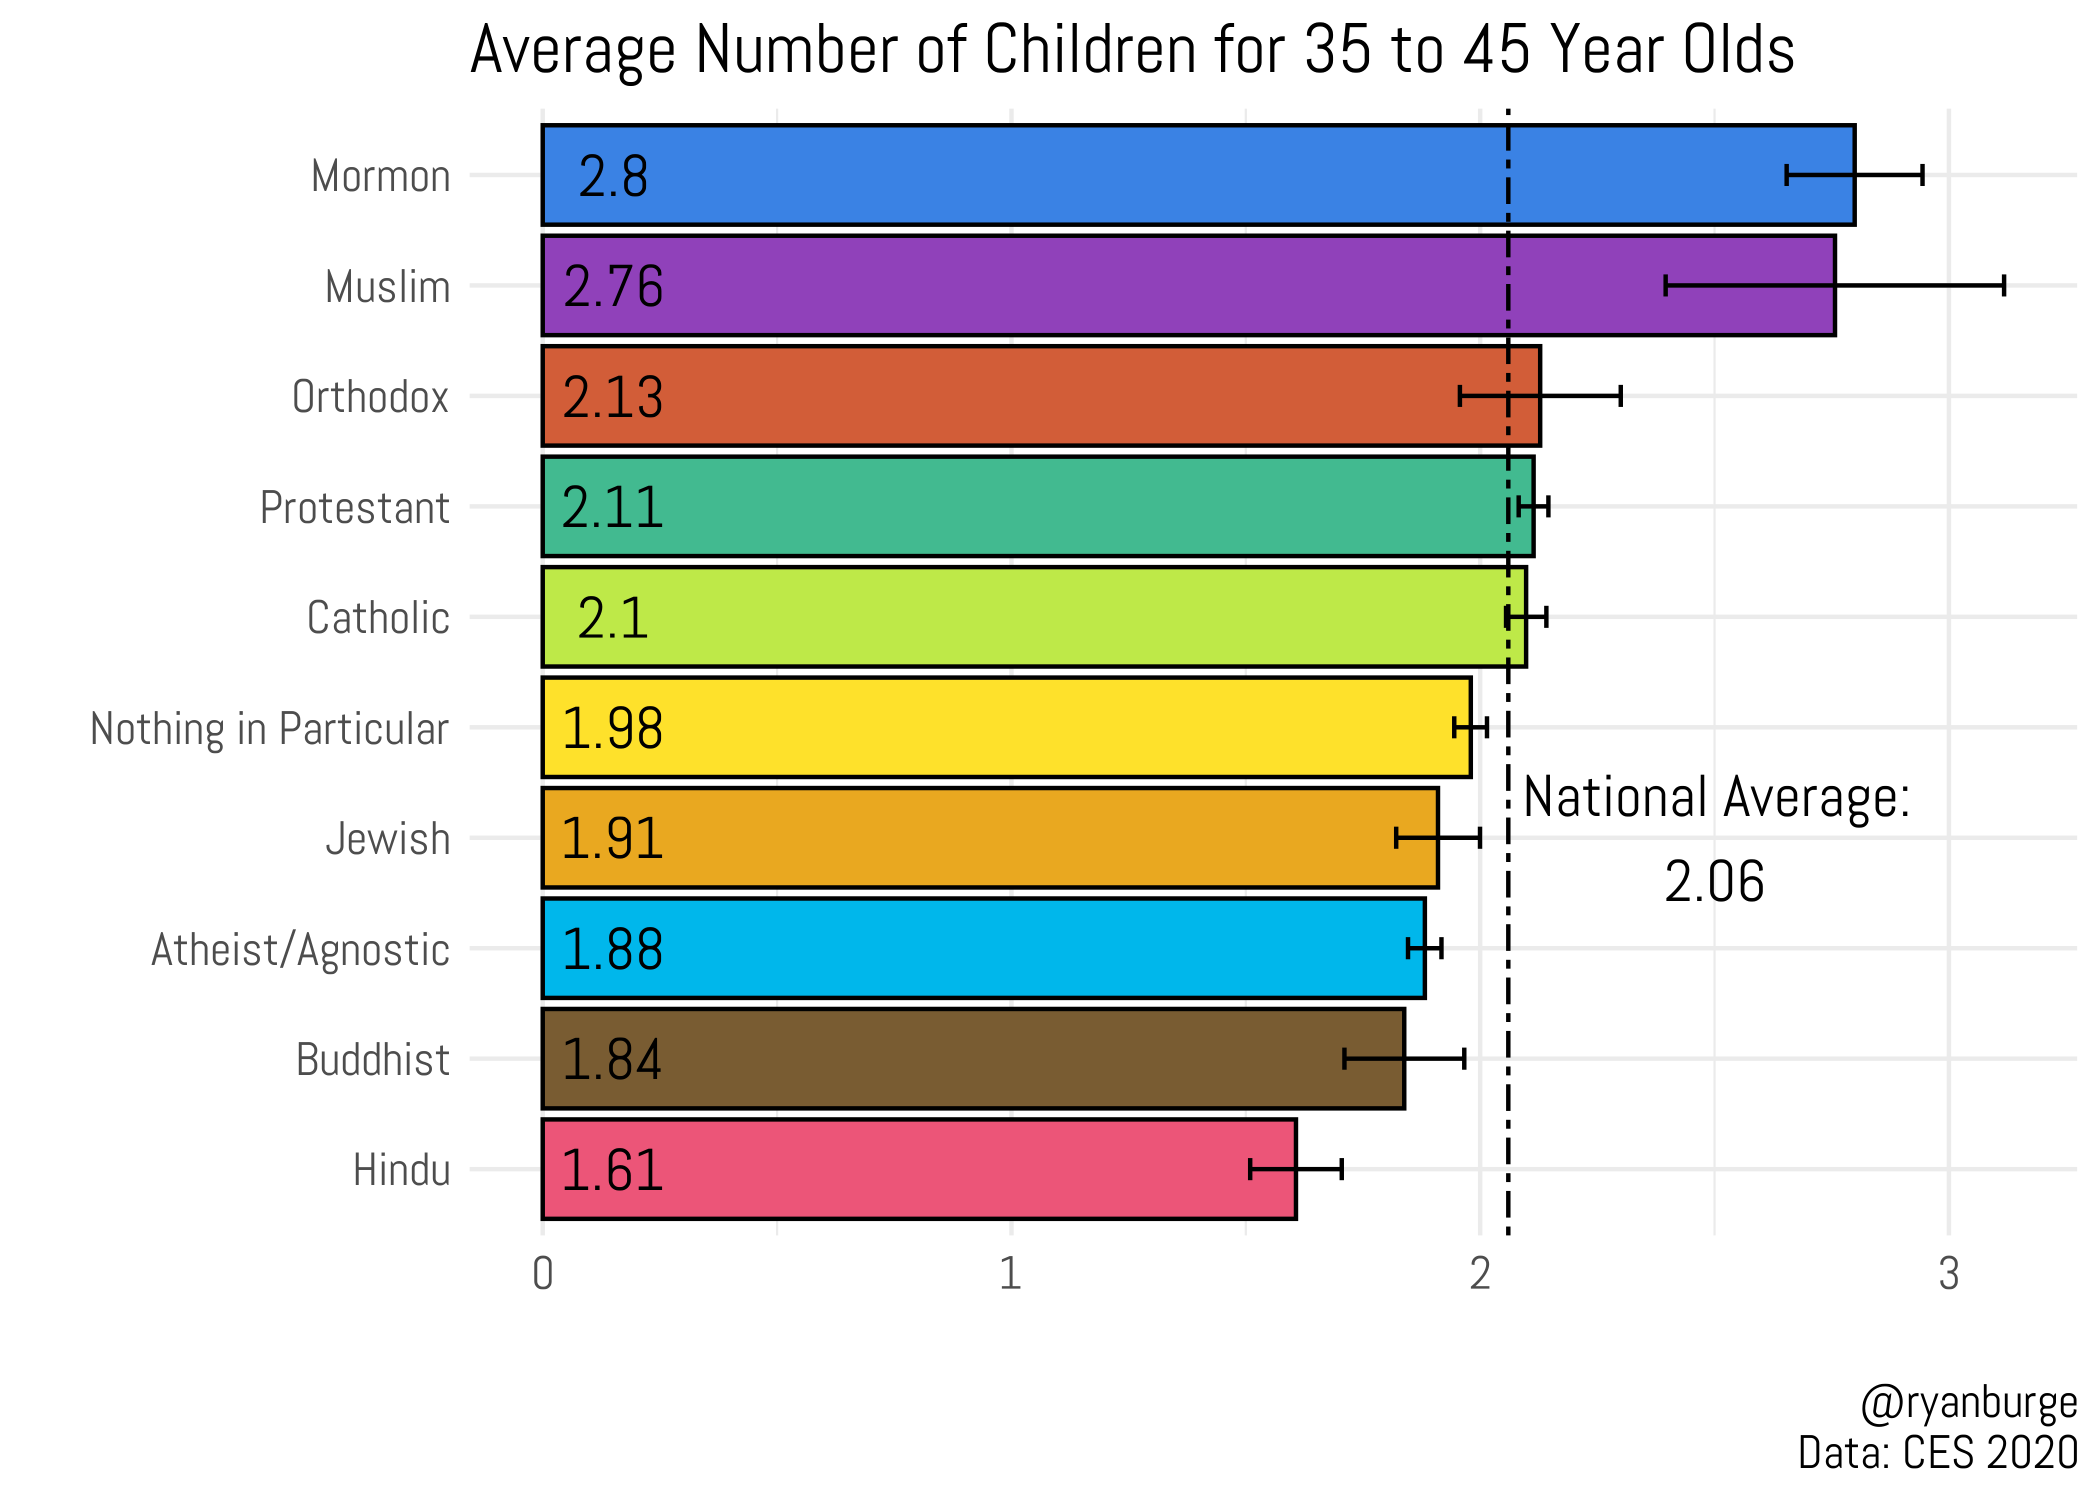
He had some really tight error bars on that, so I looked into it for a while in hopes of replicating his work, and then building off of it.
I did manage to replicate his findings, but not his error bars:
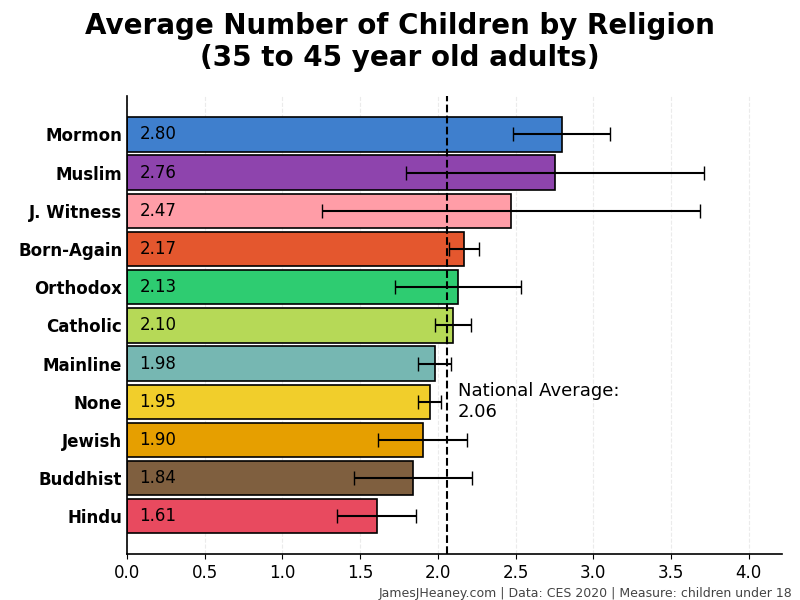
You may be wondering why Burge’s error bars are so much smaller than mine, even without pooling.
I’m wondering that, too! Clearly, I’m not as clever as I thought (yet).
In this particular slice of the CES 2020 (35-45 y.o. adults of either sex), there’s only 45 observations of Muslims (whose weights sum to just 39.9), so there must be some math I don’t know about allowing Burge to be more confident in his averages than I am. Alas, I stopped after Statistics 101 because the intro course was all my major required!
I then tried using the Cumulative CES 2006-2024, even though it would have dragged in a lot of extra data from earlier times that I didn’t really want. However, the Cumulative CES doesn’t even include the fertility variable, so it was useless to me!
Eventually, I discovered that, as long as the underlying data are extremely similar, you can use math (something called inverse-variance weighting) to pool multiple surveys together. At first, this was very cool. However, it had some drawbacks. The main thing inverse-variance weighting does is give extra weight to “stable,” unvarying samples. In one wave, though, there was only one (1!) Orthodox woman in the age range and who attended services regularly. She had three kids. Since there was only 1 woman in that sample, the math said this sample was infinitely stable (because every woman in the sample had 3 children!). So the weighting equation discarded all the other data from other Orthodox women in other waves, gave 100% of the weight to this one woman, and confidently informed me that the average Orthodox woman has exactly three children, with zero need for a confidence interval.
You can see this chart is doing something similar to the Jews. Not quite as bad, but similar problem: one wave randomly got just a few Jews with no kids, which was technically a low-variance sample and therefore ended up with 78% of the weight.
Finally, I learned that you can pool a survey reasonably well by combining their results and rescaling their weights. This isn’t perfect, either, but it appears to avoid the inverse-variance weighting problem. Hopefully I did it right! (You can check it out in the GitHub code at the bottom of the article.)
This article was a crash course in stats, much more than I expected at the outset.
The only major American religious traditions where there’s no evident association between devotion and attendance at services are Buddhism, Hinduism, and, of course, Atheism and Agnosticism.
Except Buddhists, Hindus, and Nones. (See previous footnote.)
…but I’m not going to spend half-an-hour coloring all the slices like I did on the others:
Of course, all else is never equal. Indifferent members of different religions often behave very differently from one another.
However, this is likely not because of their religion (which they don’t seem to particularly care about), but because of other factors associated with their religion, like race, socioeconomic class, age, and geographic region.
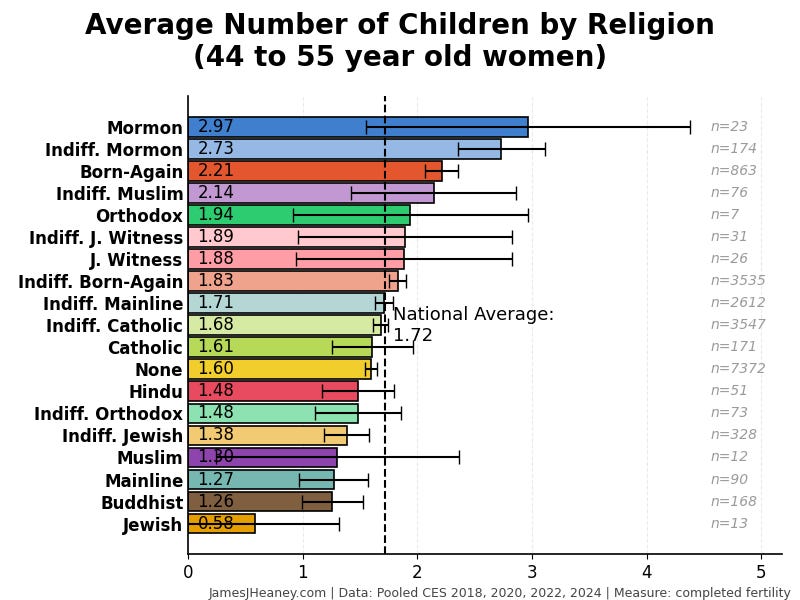
I did test for this a little, by trying out a narrower definition of “indifference.” In this chart, you count as churchgoing if you attend at least “a few times a year”. You only count as “indifferent” if you attend “seldom” or “never”:
As you can see, the pattern (mostly) holds. Churchgoing members of a religion clump together in bands with their Indifferent brethren, even when we redefine “indifferent” to count only those fully severed from the regular practice of their faiths. Fertility-wise, Indifferent Catholics are much closer to other Catholics than they are to Indifferent Jews. This continues to surprise me.
Another theory: maybe my definition of indifference was too narrow. Maybe a ton of the weekly pewsitters aren’t really involved in the religion, but are just going for something to do! (Not a very likely theory, but I was exploring the data.) So I tried redefining “indifferent” one more time. This time, anyone who attends weekly or less is considered “indifferent.” Only the extremely devoted people who go to services more than once a week count as Churchgoing here:
The error bars have gone crazy here, because the samples are so so tiny, but the pattern holds! Even the few extremely devoted Catholic women who go to Mass twice a week or more (they’re more devout than I am, that’s for sure!) still have fertility that hovers around the national average. It seems religious practice just doesn’t seem to make that big of a difference in how many babies you have! Demographic and cultural factors dominate!
LLM Disclosures: it had been many years since I did any heavy lifting with large survey sets, and I had never done it in Python, so I leaned heavily on GPT Codex in writing the Python scripts. Virtually all the code in this project was at the very least drafted, and for the most part completed, by Codex. Footnote 2 shows that I still did quite a lot of human wandering around and bumping into walls, though!
As always, I wrote the whole article, but, I sometimes enter a personal competition with GPT for the title. GPT picks a title, I pick a title, we send each title to a quarter of the mailing list, and whichever title wins becomes the official title for the article. At this writing, that competition hasn’t happened yet, so I don’t know who won or what the title of the article you just read was. The possible titles for this article were:
My title: “Fertility by Religion, James-Style”
ChatGPT’s title: “I Fixed the Biggest Mistake in Religion Surveys (and It Barely Changed the Results)”
Gotta admit, I think GPT might be on to something there. It’s a little clickbaity, true, but my title is just flaccid and inscrutable.
"Whenever someone shows you a chart about Catholics, with no filtering, you’re usually better off cutting out the middleman and just looking up a chart about Hispanics and Scots-Irish instead."
You're not actually better off if you do this, because the Scots-Irish, when they have a religious affiliation, are generally Protestants. It's a long story, but they're descended from people who England sent over to Ulster in the early 1600s to try and basically colonize Ireland.
Well this was a rather blackpilling post.